Max Temeprature
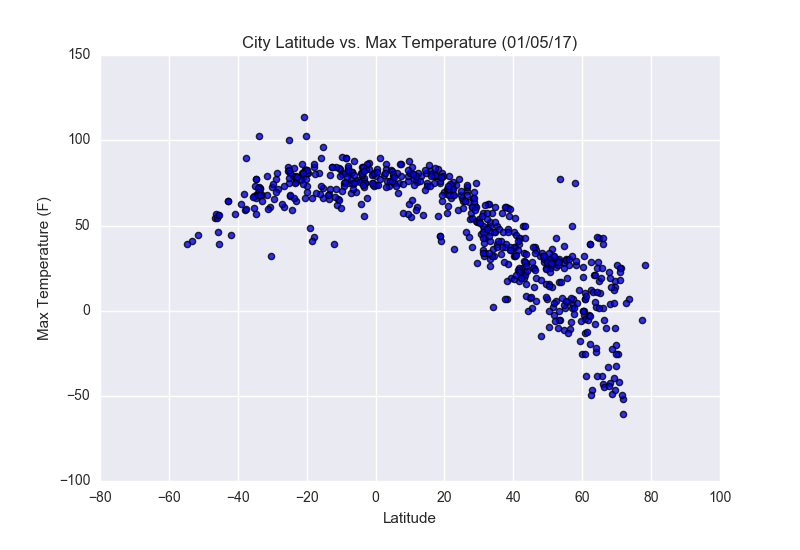
This scatter plot demonstrates the relationship between latitude and maximum temperature recorded. The shape presented resembles a parabola, with its peak between -20° and 20°, suggesting that temperatures are at their maximum closer to the equator. As the latitude increases in the positive direciton, the maximum recorded temperature appears to decrease. Negative latitudes also have a higher average maximum temperature, with no points recorded under 0 ℉.
Visualizations