Cloudiness
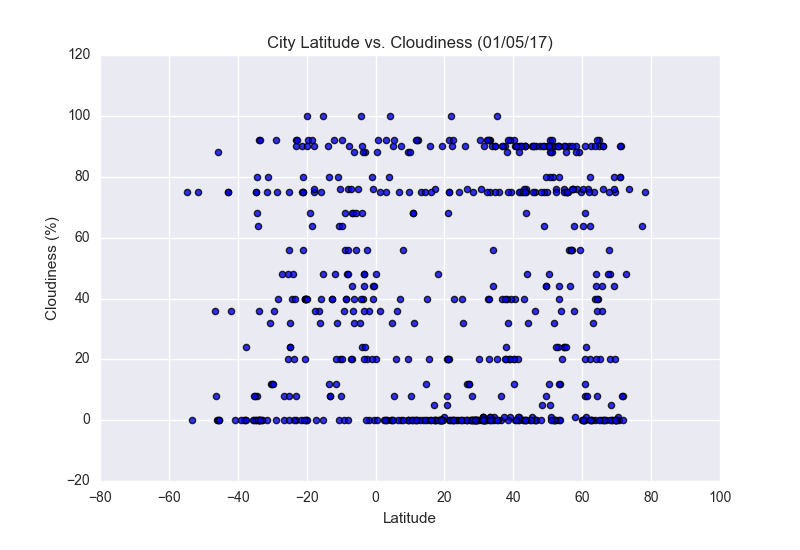
This is a scatter plot illustrating the relationship between latitude and cloudiness. Data points are randomly distributed in nearly horiozntal (cloudiness) lines, with no latitude preferences whatsoever, implying that there is no correlation between the two variables. Unfortunately, data is not available for latitdues under -60°.
Visualizations